JupyterでインタラクティブなGUI操作
Jupyter notebook は便利で python を使うなら欠かせないですよね。
ただ、いろいろできるのは知ってるけどどうやってやるのか調べるのは意外と大変です。
そこで今回は DCGAN を利用して Jupyter で以下のことを試します。
- スライドバーを使った画像の動的変化
- アニメーションの生成
- html の実行
- ファイルのインタラクティブ選択と表示
スライドバーで画像をインタラクティブに操作する方法
画像を扱ってると、ちょっとパラメータを変えて表示したいことがあると思います。
もちろん値を書き換えたり、連続的に値を変化させたり、あらかじめ値をリストに入れたりして表示するなどいろいろ方法はあります。
Jupyter では、簡単な GUI をすぐに作れるので、直感的に操作ができます。
今回は DCGAN で試していきます。
なぜ GAN かというと、潜在変数の連続的な変化をみるのに Jupyter のインタラクティブ操作が便利だからです!
model は Facebook の GAN Zoo のものを使用しました。
さっそく始めていきます。
インタラクティブ操作に入る前にいろいろ準備をします。
まずはモデルの準備です。
import torch
from ipywidgets import interact
import matplotlib.pyplot as plt
import pickle
import numpy as np
%matplotlib inline
use_gpu = True if torch.cuda.is_available() else False
model = torch.hub.load('facebookresearch/pytorch_GAN_zoo:hub', 'DCGAN', pretrained=True, useGPU=use_gpu)
これで DCGAN の学習済みモデルが利用できます。
学習済みのモデルが簡単に利用できて楽ちんです。
次は、使用する操作を関数化して定義していきます。
# 生成元のノイズを固定するために保存
def save_noise(num_images):
    noise, _ = model.buildNoiseData(num_images)
    with open('test.pickle', mode='wb') as f:
        pickle.dump(noise, f)
# ノイズの読み込み
def load_noise():
    with open('test.pickle', mode='rb') as f:
        test_noise = pickle.load(f)
    return test_noise
# ノイズから画像生成
def generate_images(model,noise):
    return model.test(noise)
# 2つの生成画像を描画
def draw_two_images(images):
    img_list = []
    for img in images:
        trans_img = img.permute(1,2,0).cpu().numpy()
        trans_img = np.clip(np.rint((trans_img + 1.0) / 2.0 * 255.0), 0.0, 255.0).astype(np.uint8)
        img_list.append(trans_img)
        if len(img_list) == 2:
            break
    plt.subplot(1, 2, 1)
    plt.imshow(img_list[0])
    plt.subplot(1, 2, 2)
    plt.imshow(img_list[1])
コメントにあるようにたいした操作ではないです。
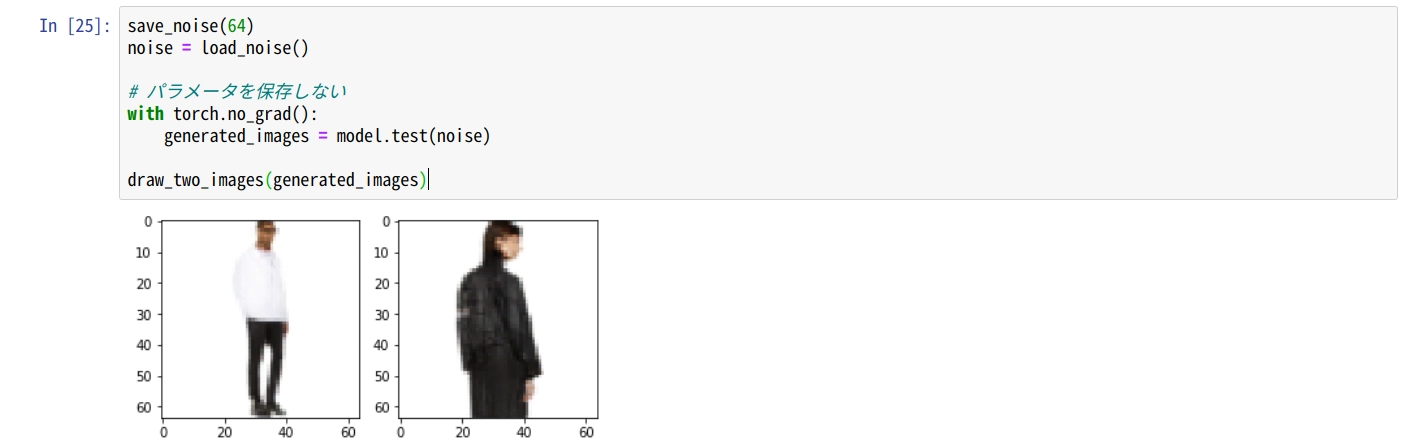
それでは試しに画像を出力してみます。
save_noise(64)
noise = load_noise()
# パラメータを保存しない
with torch.no_grad():
    generated_images = model.test(noise)
draw_two_images(generated_images)
Jupyter で実行するとこんな感じです。
次は、2つのノイズベクトルを抽出して、それらを線形補間した画像を出力します。
def get2noise(noise):
    noise_list = []
    for i in noise:
        noise_list.append(i)
        if len(noise_list) == 2:
            break
    return noise_list
def calc_interpolate(noise_list):
    num = 64
    step_size = 1/num
    step = 0
    inp_noise_list = []
    for i in range(0, num):
        r = (1 - step) * noise_list[0] + step * noise_list[1]
        inp_noise_list.append(r)
        step += step_size
    return inp_noise_list
n2 = get2noise(noise)
noise_tensor = torch.stack(calc_interpolate(n2))
images = generate_images(model,noise_tensor)
h_fig = plt.figure(figsize=[12, 6])
h_ax = plt.axes([0.0, 0.0, 0.5, 1.0])
h_ax.axis('off')
himg = plt.imshow(torchvision.utils.make_grid(images).permute(1, 2, 0).cpu().numpy())
結果はこんな感じです。
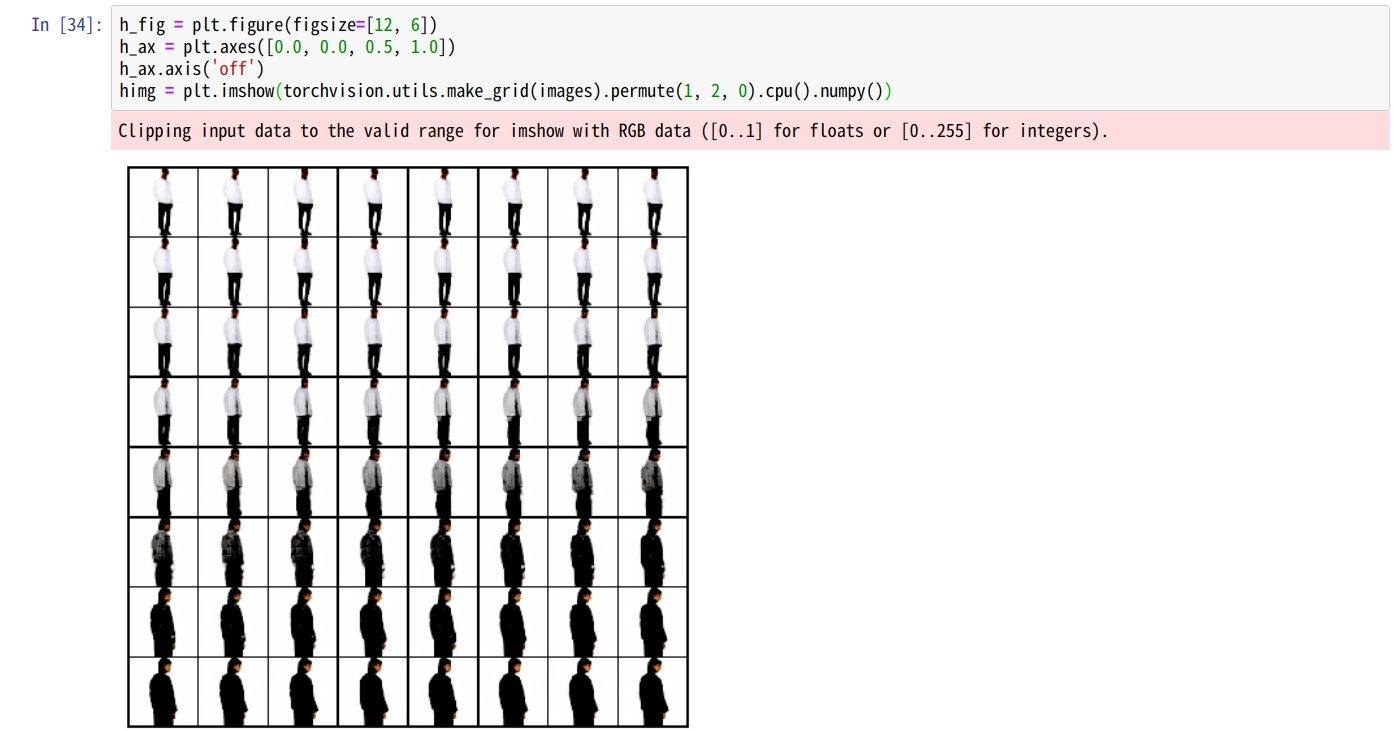
うまく補間された画像が生成できてますね。
さて!いよいよ本題のインタラクティブ操作です!
上記画像のようにあらかじめずらす間隔を定義して順番にだすのではなく、インタラクティブ操作で画像を切り替えたいと思います。
コードはこれだけです。
class two_vecor():
    def __init__(self,model,ns):
        self.vec1 = ns[0]
        self.vec2 = ns[1]
        self.model = model
    def gen_img(self, step):
        noise_list = []
        if type(step) is float:
            r = (1 - step) * self.vec1 + step * self.vec2
        else:
            step = step["new"]
            r = (1 - step) * self.vec1 + step * self.vec2
        noise_list.append(r)
        img = self.model.test(torch.stack(noise_list))
        trans_img = img[0].permute(1,2,0).cpu().numpy()
        trans_img = np.clip(np.rint((trans_img + 1.0) / 2.0 * 255.0), 0.0, 255.0).astype(np.uint8)
        plt.clf()
        plt.imshow(trans_img)
        plt.show()
n2 = get2noise(noise)
tmp = two_vecor(model, n2)
# スライドバー表示
interact(tmp.gen_img, step=(0,1, 0.1))
結果はこんな感じです。
<video class="cst_video" src="/media/jupyter_interact/test.mp4" controls autoplay muted playsinline loop
やりたかったことができてます!
step の値をいじることで、スライド時の値の幅や値の範囲を設定できます。
jupyter 素晴らしい
アニメーションの生成
インタラクティブ操作じゃなくてちょっとした動画で十分なときもあると思います!
jupyter ではアニメーションの再生も可能です。
先程とほぼ同じ関数を利用します。
変更点はとりあえずこれ
#%matplotlib inline
# 二回実行する
%matplotlib notebook
%matplotlib inlineから%matplotlib notebookに変更してください。
で、**%matplotlib notebook**を定義したセルを二回実行してください。
よくわからないのですが、二回実行しないとアニメーションが再生されません。
次に新しく以下の関数を定義します。
アニメーションに使う画像を作成する関数です。
def gen_img(step):
    n2 = get2noise(noise)
    noise_list = []
    r = (1 - step) * n2[0] + step * n2[1]
    noise_list.append(r)
    img = model.test(torch.stack(noise_list))
    trans_img = img[0].permute(1,2,0).cpu().numpy()
    trans_img = np.clip(np.rint((trans_img + 1.0) / 2.0 * 255.0), 0.0, 255.0).astype(np.uint8)
    return trans_img
そして以下がアニメーション作成部分です。
import matplotlib.animation as animation
from PIL import Image
#figオブジェクトを作る
fig = plt.figure()
ims = []
test_list = []
step = 0.
step_array = np.arange(0.0,1.0,0.05)
for i in range(len(step_array)):
    im = gen_img(step_array[i])
    img = Image.fromarray(im)
    test_list.append(im)
    ims.append([plt.imshow(im)])
    img.save("./img/sample_{}.png".format(i))
ani = animation.ArtistAnimation(fig,ims, interval=400, repeat_delay=1000)
ani.save('anim.gif', writer='imagemagick', fps=4)
plt.show()単純に画像のリストを作成してanimation.ArtistAnimationにわたすだけです。
次で利用するので、上記のコードで生成した画像を保存しておきます。
以下が作成した gif です。
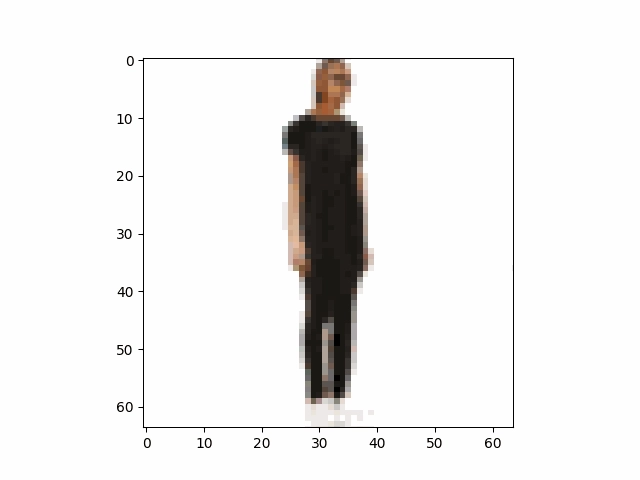
うまくできてます!
html の実行
jupyter では HTML も実行できます。
先程保存した画像を HTML を利用してアニメーションのように表示してみます。
import time as time
from IPython.display import display, HTML, clear_output
# animationはHTMLでもできる
i = 0
for i in range(20):
    time.sleep(1)
    clear_output(wait=True)
    html_code = "<img src=./img/sample_{}.png>".format(i)
    display(HTML(html_code))
結果は以下になります。
ちょっと表示間隔が遅くてわかりづらいですが、できてます!
ファイルのインタラクティブ選択と表示
実は調べてみると、jupyter はほかにもいろいろ便利な GUI を簡単に実装できます。
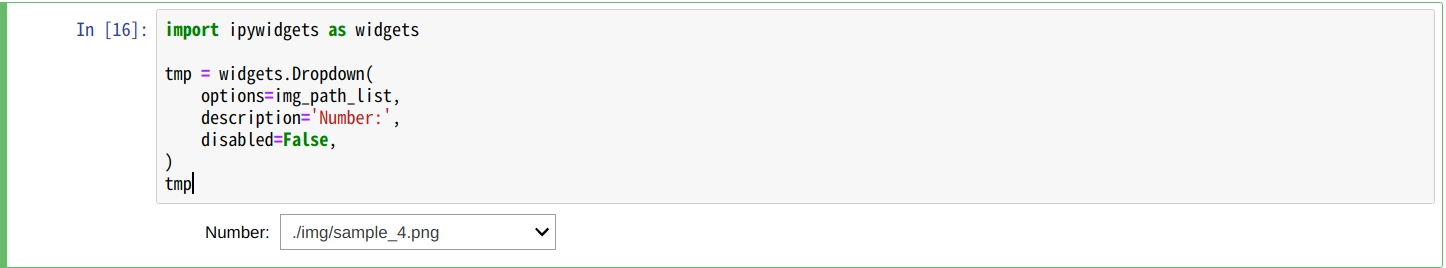
以下はファイルをドロップダウンで選択して、選択したファイルを表示するものです。
import ipywidgets as widgets
tmp = widgets.Dropdown(
    options=img_path_list,
    description='Number:',
    disabled=False,
)
tmp
実行するとこんな感じです。
次のセルで選択したファイルを表示します。
print(tmp.get_interact_value())
file_name = tmp.get_interact_value()
file = open(file_name, "rb")
image = file.read()
widgets.Image(
    value=image,
    format='png',
    width=300,
    height=400,
)
実行すると以下のようになります。
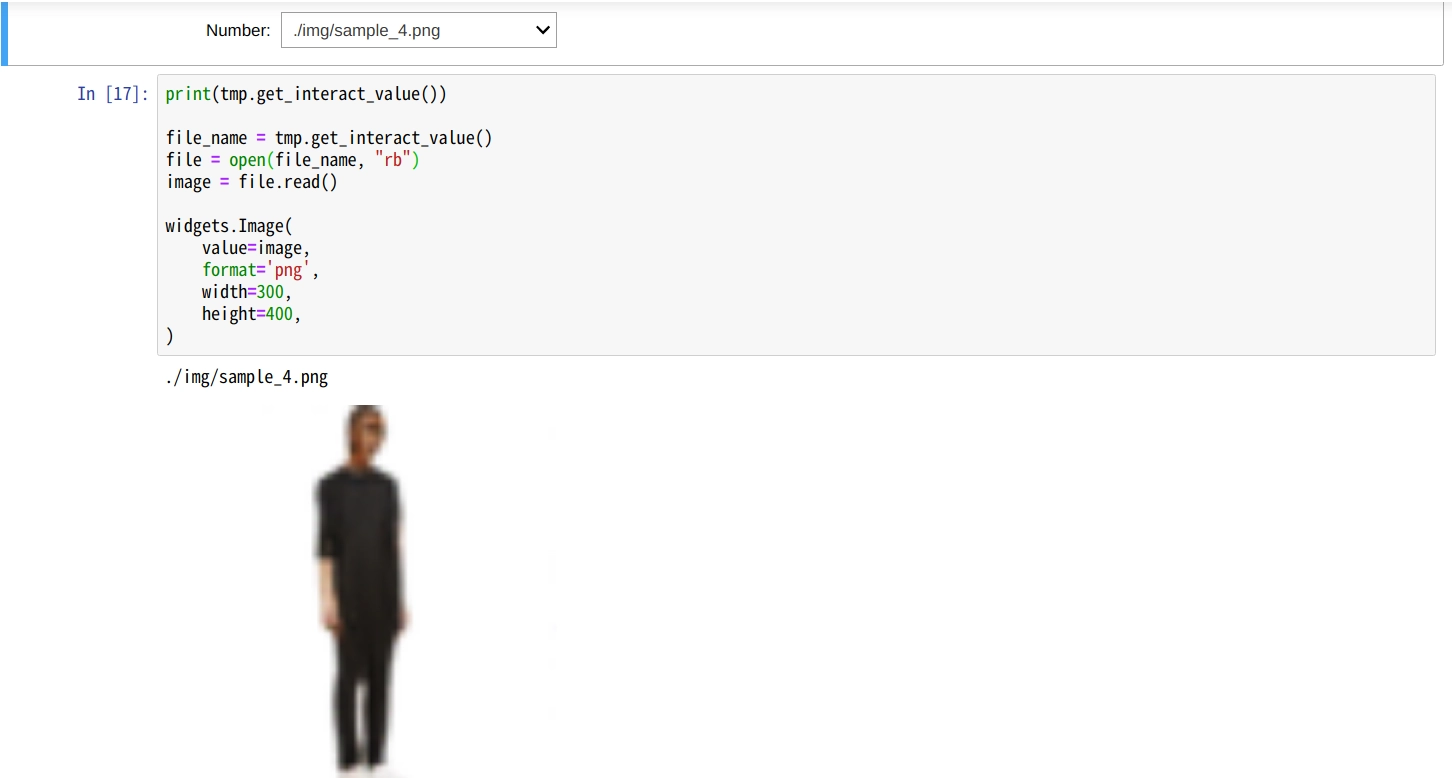
しっかりドロップダウンで選択したものが表示されてます。
画像表示もmatplotlibより場合によっては使いやすいかもしれないです。
まとめ
jupyter の ipywidgets のめちゃめちゃ便利です。
こちらに他の widgets の使い方についても記載されています。